


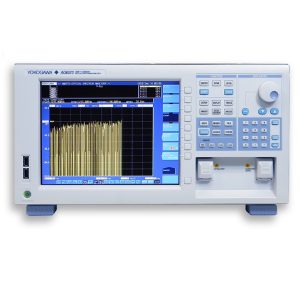
YOKOGAWA AQ6374 Functions & Key Features:
Active component test
Characterization of laser sources
Today various light sources such as DFB-LD, FP-LD and VCSEL emitting in the visible light to mid-infrared wavelength region are mounted into many different devices/systems used in different areas of application, such as:
- Telecommunication: with glass fiber or plastic fiber
- Industrial: Barcode scanners, LiDAR surface scanners
- Consumer electronics: audio output of Hi-Fi audio systems, laser printers, computer mice

Characterization of sources used in laser Absorption Spectroscopy
Laser Absorption Spectroscopy is a measurement technique used to detect and measure the concentration of gases in the air, and in open or closed environment. The lasers used in Absorption Spectroscopy require excellent single-mode operation performance, which directly determines the limits of detection. Furthermore such lasers should produce a stable oscillation in the absorption region in order to achieve sensitive detection of the gas of interest. Most of the greenhouse gases, for example CO2, SO2, NOx and CH4, have strong absorption lines in the 2-3 μm wavelength region.
The lasers used in Absorption Spectroscopy are DFB-LD and VCSEL. Important parameters for evaluating the performance of these lasers are the Side Mode Suppression Ratio (which is the amplitude difference between the main mode and the side mode), and the Spontaneous Emission level (which is the magnitude of background noise light). Both parameters can be accurately and quickly measured by the AQ6375B and AQ6376.
Characterization of Supercontinuum light sources
Supercontinuum light is generated by promoting highly nonlinear optical processes in special materials, e.g. photonic crystal fiber, by pumping them with a mode-locked pulsed laser (typically a femtosecond Ti: Sapphire laser). Supercontinuum light can be best described as ‘broad as a lamp, bright as a laser’, in fact it matches the characteristics of incandescent and fluorescent lamps—i.e. very broad spectrum—with the characteristics of lasers—i.e. high spatial coherence and very high brightness, which enables optimum coupling to a fiber and outstanding single-mode beam quality.
The Supercontinuum light sources are nowadays finding applications in a diverse range of fields, including optical coherence tomography, frequency metrology, fluorescence lifetime imaging, optical communications, gas sensing and many others.
The AQ6370 series, thanks to its premium performance, are the ideal instruments to test and characterize Supercontinuum light sources during their pre and post production quality checks.

Passive component test
Visible LED test
The optical spectrum of visible LEDs used in lighting, signage, sensing and other applications can be measured and analyzed. By supporting the large core fiber input, AQ6373B and AQ6374 can efficiently get the LED light and measure its spectrum.The built-in Color Analysis function automatically evaluates the dominant wavelength and the chromatic coordinates of the source.

In conjunction with a broadband light source such as ASE, SLD, SC light source, the OSA can simply perform evaluation of passive devices such as WDM filters and FBG. Superb optical characteristics of the AQ6370 series enable higher resolution and wider dynamic range measurements. The built-in optical filter analysis function simultaneously reports peak/bottom wavelength, level, crosstalk, and ripple width.

Loss wavelength characterization of optical fibers
Loss values of optical fibers are different depending on wavelengths of propagating optical signals. These differences are caused by the absorption by optical fibers and the effect of Rayleigh scattering. The loss values vary by the materials and types of fibers: in the case of a quartz single mode fiber, a loss around 1.55 μm is about 0.2 dB/km, which is the smallest, and around 1.4 μm a large loss occurs due to water ions (OH). The loss wavelength characterization of this type of optical fibers requires measuring a wide range of wavelengths.
With the combination with a white light source, the AQ6374 efficiently characterizes the loss wavelength measuring a wide range of wavelengths. The loss value is displayed in terms of the loss per unit length of the optical fiber.

Characterization of Fiber Bragg Gratings
A Fiber Bragg Grating (FBG) is a type of distributed Bragg reflector constructed in a short segment of optical fiber that reflects particular wavelengths of light and transmits all the others. This is achieved by creating a periodic variation in the refractive index of the fiber core, which generates a wavelength specific dielectric mirror. A Fiber Bragg Grating can therefore be used as an inline optical filter to block certain wavelengths, or as a wavelength-specific reflector. The primary application of Fiber Bragg Gratings is in optical communications systems: they are specifically used as notch filters and they are also used in optical multiplexers and demultiplexers with an optical circulator, or optical add-drop multiplexer (OADM). Fiber Bragg Gratings tuned on 2-3 μm region are also used as direct sensing elements for strain and temperature in instrumentation applications such as seismology and in pressure sensors for extremely harsh environments. To characterize FBGs, the high wavelength resolution and high dynamic range of the AQ6370 series are indispensable.

Gas detection and concentration measurements
Used together with a broadband light source like Super Continuum (SC) or Super Luminescent Diode (SLD), the AQ6370 series can show the absorption spectrum of the gas mixture under test.

Hydrogen Cyanide absorption spectrum measurement
YOKOGAWA AQ6374 FUNCTIONS:
16 data analysis functions
- WDM (OSNR) analysis
- Optical Fiber Amplifier analysis
- DFB-LD analysis
- FP-LD (VCSEL) analysis
- LED analysis
- Spectral Width analysis
- Notch Width analysis
- SMSR analysis
- PMD analysis
- Optical Power analysis
- Color analysis
- Optical Filter analysis (PK, BTM, WDM-PK, WDM-BTM)
- Go/No-Go Judgment
Purge feature
 |
Due to the high resolution and sensitivity of the AQ6374, it can actually detect the presence of water molecules in the air. The water vapor is detected in the upper Near-IR wavelength region and could overlap with or mask the spectral characteristics of the actual device under test in that particular region.
By continuously supplying a pure purge gas such as nitrogen to the monochromator through the ports on the back panel, the AQ6374 can reduce the influence of water vapor absorptions and provide more reliable and accurate measurements than ever before. |
Built-in cut filter for high order diffracted light
Due to the diffractive technology used, the monochromator in some circumstances could generate high order diffracted light which appears at wavelengths equal to the integral multiple of input wavelengths.
The built-in calibration source
Ambient temperature change, vibrations and shock affect the measurement accuracy of high precision products like optical spectrum analyzers. We want our OSAs to be able to deliver always the precise measurements they were designed for, therefore our instruments are equipped with a light source for calibration.
Calibration process is fully automatic and takes only 2 minutes to complete. It includes:
- The Optical Alignment function, which automatically aligns the optical path in the monochromator to assure the level accuracy.
- The Wavelength Calibration function, which automatically calibrates the spectrum analyzer with the reference source to ensure the wavelength accuracy.

Data logging function
Records analysis results such as WDM analysis (OSNR, optical signal/noise ratio), distributed feedback laser diode (DFB-LD) analysis, and multi-peak measurements at up to 10000 points per channel with time stamps. Recorded data can be displayed in table and graphical forms. This function is useful for the long-term stability testing and temperature cycle testing of systems and devices. The optical spectrum of each measurement can also be stored for reviewing and troubleshooting.

Advanced marker function
Adds markers to obtain the power spectral density and the integrated power of a designated spectrum. This new feature makes it easy to get an OSNR value of the signal, whether modulated or not, directly from its spectrum.
Building automated test systems
Any model of the AQ6370 Series, thanks to the built-in Macro Programming Function, can perform automatic measurements and control external equipment through its remote interfaces.
GP-IB, RS-232 and Ethernet ports are available to have the instrument remotely controlled by a PC and to transfer standard SCPI-compatible or proprietary AQ6317- compatible commands. Also LabVIEW® drivers are available.
The AQ6370 Viewer

Real-time remote control
The AQ6370 Viewer is a software package, which replicates The OSA’s screen on a PC and enables:
- Remote control and operation of the instrument
- Display, analyze and transfer the data acquired by the instrument on your remote PC
The AQ6370 Viewer is appreciated especially by:
- Production Managers, who can command the instrument and collect its measurement results from their office without physically going to the actual production line.
- Service Engineers, who can help their customers or colleagues by setting the instrument in the proper way, tuning it on the device/system they want to test.
Smoothing function
Reduces the noise on the measured spectrum.


Reviews
There are no reviews yet.